Process Analytics with Plotly and Docker
28 Dec 2018 Python, Flask, Docker, Plotly, VueJSIntroduction
Some of our PLCs were configured to generate data and save it into a .csv file on the client’s Operating System. This system was usually Windows but could be any version of it. We needed a webapp which could chart the data in a user friendly way, and could be run in any OS. This is why we decided to run the web server inside a Docker container.
The webapp itself consisted of a small VueJS app for the frontend and a Flask backend which would import the python Plotly module for chart creation.
The main structure of the project was
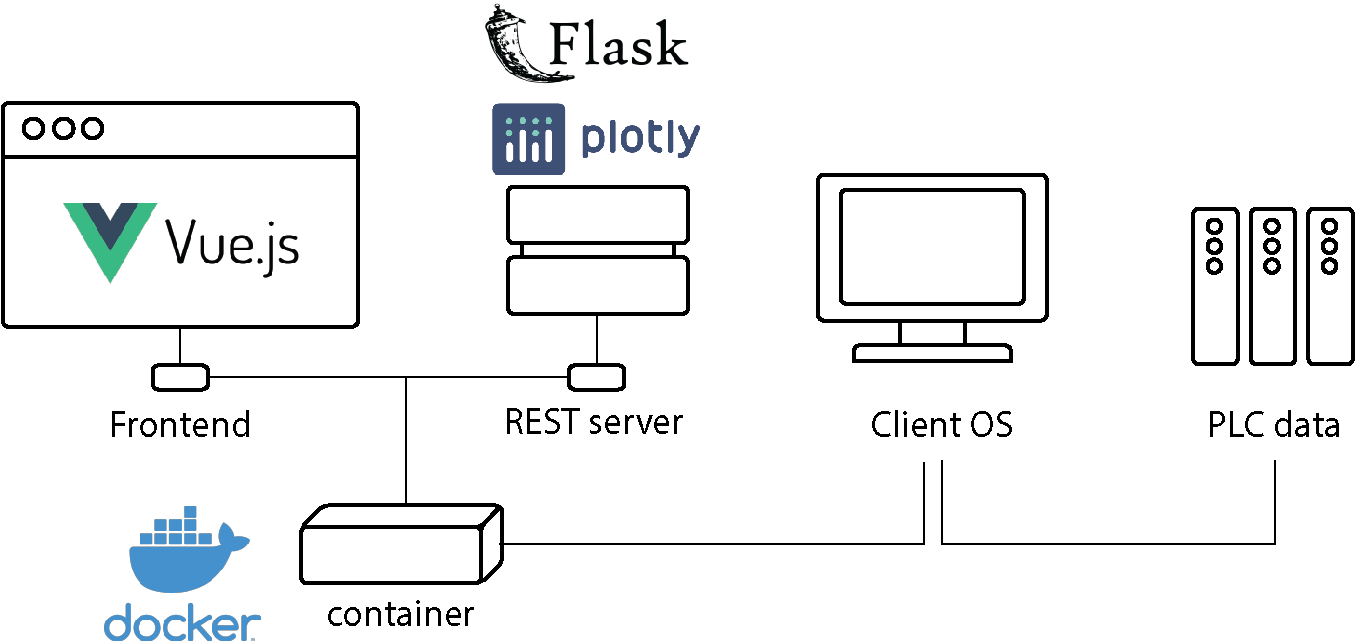
Project Outline
VueJS Frontend
VueJS Configuration
Using VueJS together with Flask’s Jinja2 template engine required modifying VueJS configuration to use [ brackets instead of the default { which are used by Jinja. This is done by setting the delimiters inside the VueJS app:
var app = new Vue({
  el: '#app',

  delimiters: ["[[", "]]"],

  data: { ... },

  methods: { ... }
})
User interface
Users needed to select which CSV they wanted to chart, and which variables they wanted to see. The color and line type could also be configured in this step.
Selecting data to graph
Flask Backend
Creating Charts with Plotly
Once the csv and the variables were selected, Flask would run the plotly module and create a unique graph.html file. After building the chart, the user would be redirected and it would be loaded using the Jinja2 engine.
@app.route("/buildGraph", methods=["GET", "POST"])
def buildGraph():
  if request.method == "POST":

    filename = "graph.html"
    variables = request.form.getlist('variables')

    # Creates a chart with Plotly and saves it with the filename
    plotted_graph = plotly.graph(csv, variables, filename)

    return redirect(url_for('plot', filename=filename))


@app.route("/plot")
def plot():
	return render_template("plot.html", graph=graph)
Docker
Building the image
The image can be built from python with the following Dockerfile.
FROM python:3.6.5-slim

LABEL maintainer="Miguel Zarco"

WORKDIR /app

ADD . /app

RUN pip install --upgrade pip

RUN pip install -r requirements.txt

CMD ["gunicorn", "--bind", "0.0.0.0:5000", "app:app"]
Running the image with an external volume
Once the image is created, we need to tell it where the csv files are located. This is done by attaching an external volume. Note that the csv_folder directory should exist in the app itself, in order for docker to use it as a mountpoint.
docker run -p 5000:5000 -v /path/to/csv_folder:/app/csv_folder app